

How Does This Exhibition Make You Feel? Measuring Sensory and Emotional Experience of In-Gallery Digital Technology with GSR Devices
Jingyu Peng, University of Leicester, UK
Abstract
The trend of the "sensory turn" in academic study (that has aimed to recover a comprehensive understanding of the body and senses), now offers us a brand-new perspective. And it is a perspective that can complement (and perhaps even challenge) some of our orthodox ways of understanding and evaluating in-gallery digital interactives. It is an approach to evaluation beyond the traditional models of usability and learning—and into emotion and sensation. Poignantly, just as museum studies writing has been affected by this turn to emotion and to the senses, so we have also seen the arrival of emerging formats of in-gallery digital technology. VR, AR, 3-D printing, multi-touch, are very different from traditional interactives. This in media that is more likely to involve multi-sensory experience, enable manipulation by multiple users, and create highly immersive viewing experience—all of which questions the appropriateness of our classic set of existing evaluation tools. We are left questioning whether our classic visitor-studies toolset is effective enough for measuring user experience of the new wave of in-gallery technology. Inspired by both this "sensory turn" and this "new wave." this paper will discuss how to measure visitors’ sensory and emotional experience with in-gallery technologies. The research is based on fieldwork conducted at National Space Centre, UK. After testing the usefulness of traditional evaluation tools (including questionnaire, observation and interviews), the study turned to other disciplines to design a new evaluative framework for measuring emotion and sensation in-gallery. This paper shares the findings, the practical application, and value of using Galvanic Skin Responses (GSR) techniques to effectively measure museum visitors’ sensory and emotional experience with in-gallery interactives.Keywords: Sensory turn, visitor studies, evaluation methods, sensory and emotional experience, physiological measurements
Introduction
In the last 30 years, there has been a discursive revolution within the social sciences and the humanities that aimed to recover a comprehensive understanding of the body and senses (Uchida and Peng, 2019). Following key writers in museum studies and related areas, this whole trend of the “sensory turn” in the academy, now offers us a brand-new perspective. And it is a perspective that can complement (and perhaps even challenge) some of our orthodox ways of understanding and evaluating in-gallery digital interactives. It is an approach to evaluation beyond the traditional models of usability and learning—and into emotion and sensation.
Added to this recent sensory turn, has been the arrival of new and emerging formats of in-gallery digital technology. Virtual Reality, Augmented Reality, 3-D printing, and multi-touch are very different from traditional interactives. This is media that is more likely to involve multi-sensory experience, to enable manipulation by multiple users, and to create highly immersive viewing experiences—all of which questions the appropriateness of our classic set of existing evaluation tools. We are left questioning whether our orthodox visitor studies toolset is effective enough for measuring user experience of the new wave of in-gallery technology.
Inspired by both the “sensory turn” and this “new wave,” this paper will discuss how to measure visitors’ sensory and emotional experience with in-gallery technologies. The research is based on fieldwork conducted at the National Space Centre, Leicester (UK). After testing the usefulness of traditional evaluation tools (including questionnaire, observation and interviews), the research turned to psychology, marketing, and other study areas to design a new evaluative framework for measuring emotion and sensation in-gallery. This paper will highlight, in particular, the practical application and potential of using Galvanic Skin Responses (GSR) techniques, to effectively measure museum visitors’ sensory and emotional experience with in-gallery interactives. It is the first example of using GSR techniques for researching visitors experience with digital technologies in museum field.
The Sensory Turn
Sensation is an essential part of our experience and reality. The way visitors experience museums is also a combination of sensory, aesthetic, intellectual, and social factors. Therefore, understanding the sensory experience in museums is crucial for a better understanding of the overall visiting experience.
One of the most remarkable elements of the sensory turn in museum studies is the revival of the sense of touch (Howes, 2014). Drawing from results obtained in four workshops, “Touch and the Value of Object Handling,” funded by the Arts and Humanities Research Council, Chatterjee’s (2018) edited volume addresses issues related to different aspects of touch in museums (particularly in history and art museums) and other cultural institutions. Through discussions about the history of touch in museums, neuroscience perspectives on touch, touch and emotions, new digital technologies for enhancing tactile experiences, and the social and therapeutic value of touch, the book examines the importance of touch in museums from a wide range of perspectives. Similarly, as expressed in the academic conference, “Magic Touch” (held in the Institute of Archaeology, University of London), Pye (2007) also approaches the power of touch from different angles, including history, science, technology and visitors’ experience. Other scholars have approached the subject from specific perspectives, such as Black (2005), who reintroduced touch as a means to enhance visitors’ engagement through object handling, and Candlin (2010), who discussed the musicological interpretations of touch in art history and historical museum practice.
Compared to the notion of touch, other non-visual senses are less explored in the field of museum studies, with fewer scholars addressing issues of sound, smell, taste and embodiment. A critical resource for understanding sensory stimulation in museums (especially in terms of the less-explored senses) is the edited volume by Levent and Pascual-Leone (2014). In this book, Cluett (2014) examines the role of sound in experiencing artworks and the history and development of sound as a curatorial theme from 1966 to contemporary exhibitions. Voegelin (2014) offers practical guidance and examples on visiting museums and galleries through “soundwalking.” For “the forgotten sense” (Stevenson, 2014) of smell, Drobnick (2014) presents curatorial examples of exhibiting scent-based artworks and points out challenges for curating olfactory artworks. From the neuroscience perspective, Stevenson (2014) analyses the use of smell in exhibitions and how it could enhance the museum experience thanks to the unique physiological characteristics of smell. In regard to the sense of taste, a sense that is rarely researched in the museum context, Mihalache (2014) highlights its connection to culture and education and its potential for creating a more participatory and multi-sensory museum experience.
In addition to the five senses, the embodiment experience has also received increasing attention. For instance, using a historical approach, Leahy (2012) analyses visitors’ embodied encounter with museums by discussing theories, politics, and practices of visitor embodied experience from the eighteenth centuries to present. Also, Dudley’s (2010) work deals with the sensory and emotional sphere with an emphasis on the engagement with objects. Some chapters specifically mention the need for embodied sensory engagement with physical things in museums and galleries, to avoid being limited by the visual.
The predictions that the human brain makes and the nature of experience inherently involve sensory stimuli from multiple channels (Pascual-Leone and Hamilton, 2010). Consequentially, museums should consider shaping and creating a multi-sensory visiting experience that combines visual, auditory, olfactory, tactile interactions, and other senses (Pascual-Leone et al., 2005). The numerous publications addressing visitors’ sensory engagement in museums and cultural institutions not only encourages museums to go beyond the visual and create a more accessible experience for all but also provides us with a new lens to understand and evaluate the museum experience.
Characteristics of New In-gallery Technology
Across a variety of museums and other cultural institutions, three distinctive formats of digital installations have emerged: multi-sensory, high immersiveness and multi-user.
Providing a multi-sensory museum experience is not limited to academic discussion, but it is also a key characteristic of emerging in-gallery technology. The new generation of museum interactives is no longer limited to pressing a button, clicking a mouse, using a keyboard or watching a video, which mainly involve stimulation through a single sensory channel. They have become more interactive, engaging, and multi-sensory. This kind of experience has become more and more common in museums nowadays. Rain Room (http://sharjahart.org/sharjah-art-foundation/projects/rain-room) the Mori Building Digital Art Museum are typical examples of multi-sensory digital installations.
Rain Room is a sound and light installation designed by Random International. Supported by 3-D tracking cameras which can detect people’s movement in the space, this digital exhibit allows visitors to walk in the “rain” without getting wet and enjoy the sensory experience with the combination of art, technology, and nature. Before becoming a permanent installation at the Sharjah Art Foundation in the United Arab Emirates, the exhibition travelled to the Barbican, London (2012), MoMA, New York (2013), Yuz Museum, Shanghai (2015) and LACMA, Los Angeles (2015 to 2017), and caused a splash everywhere it went. Similarly to how Rain Room impressed visitors with the multi-sensory feeling of walking in the rain, teamLab Borderless at the MORI Building DIGITAL ART MUSEUM, Tokyo, immerses visitors in natural scenery as well. With a 10,000-square-meter exhibition area, visitors can move freely in the borderless world created by light and sound and explore “the forest of flowers,” wander in the “crystal world,” and dance with “butterflies.” What made teamLab Borderless even more unique, is the experience that mixes the visual, sound and taste in the En Tea House (https://www.teamlab.art/ew/flowersbloom/), where viewers can enjoy seasonal flowers bloom in their tea cup. The projected artwork starts when tea is poured in a cup. Then the projection changes based on the amount of water in the cup in real time, and when the tea is finished, flowers disappear from the empty cup.
The second trend in the new wave of digital technology in museums and galleries is the high immersiveness. The development of new technologies—such as big touchscreens, virtual reality and 3-D projections—give museums the possibility to design more immersive experiences for their audiences. The projection show called “Dream of Eternity” (Figure 1) at the Human Provincial Museum, China, is one example of immersive experience. When the museum reopened in 2017, the Mawangdui collection, the most renowned section of the museum, was exhibited in this show by using projections to highlight details on the life-sized recreation of a Han Dynasty tomb (19.5m x 17.8m x 17m). Along with traditional music, the show uses typical Han Dynasty drawing patterns from the collection to tell the story of the owner of the tomb, Madam Xinzhui, and her dream of eternal life. The visual and auditory effects, the architecture, and the atmosphere of the space work together to immerse viewers in the Han people’s dream. The second example that shows the immersive nature of new in-gallery digital media is The Virtual Orchestra (Figure 2).
This ten-room installation showcases, in each room, screens playing videos of different performers and broadcasts surround sound. Walking through the exhibition, viewers can go “inside” each room to experience a symphony orchestra. Additionally, in the last part of the exhibit, visitors have the opportunity to wear a VR headset. The 3-D audio and video allow them to go inside a concert hall and experience the orchestra up close. Viewers are also able to focus on a particular performer simply by turning their heads. Van Gogh Alive is another great illustration of immersive experience, as it is a revolutionary way of engaging with artworks. In this multi-screen environment, visitors are surrounded by high-definition projections on walls, columns, and floor. In a combination of light, colour and sound, visitors can “dive into” the masterpieces and Van Gogh’s world.
 |
| Figure 1: Photo of “Dream of Eternity” in Human Provincial Museum, China.
|
 |
| Figure 2: Photo of a corner of one room in The Virtual Orchestra. |
As stated by Chan (2014), museums are moving away from designing single-person programmes to focusing on activities that can apply to multi-user audiences. The third key characteristics of new technology is that they are more likely to be manipulated by multiple users at the same time. Numerous museums have installed touchscreen tables, some of which can be used by multiple users. One of the most renowned examples are the touchscreen tables at the Cooper Hewitt Smithsonian Design Museum. Their ultra-high-definition touchscreen tables not only allow multiple users to browse thousands of objects in the museum’s collection (and learn the history and stories behind them) but also to create and share their own designs with others. The 17-meter-long touchscreen table in the Churchill War Rooms at the Imperial War Museum, London, is another example of multi-user, in-gallery digital installations. This long table displays a timeline of the war years across the biggest room in the museum. Visitors can walk through the room and explore what happened during every month of the war.
Designing a New Evaluation Framework
The new generation of in-gallery technology is very different from the traditional formats of digital interactives: they are multi-sensory, immersive, and able to be manipulated by multiple users at once. These features challenge our existing evaluation tools. Are they still capable of capturing people’s experience with new technologies? Are the classic tools of evaluation (interviews, questionnaires, and observations) able to reflect the differences of the new characteristics of interactives? Also, as noted above, the turn towards understanding human senses and sensory engagement in museum studies offers a new perspective on evaluating in-gallery interactives. Based on these questions, the research aims to measure visitors’ experience with in-gallery digital technologies.
The research is conducted in collaboration with the National Space Centre (NSC), Leicester, UK. NSC is a museum and the UK’s largest attraction in space science and astronomy. The NSC was chosen as a case study for the research because it has various formats of in-gallery interactives, and an in-house studio (NSC Creative), which specialises in designing immersive projects for theme parks and museums. The Sir Patrick Moore Planetarium, Venus Simulator, and Interactive Table were selected as examples of this new generation of in-gallery technologies, and they represent the high immersiveness—the multi-sensory and multi-user nature of new digital interactives, respectively. To be more specific, Sir Patrick Moore Planetarium (Figure 3) is a 360-degree full dome planetarium, as well as the largest planetarium in the UK. The planetarium show chosen to conduct the research is called We Are Stars!, and it tells the story of the universe from its birth to today. This 25-minute immersive cinema experience is suitable for both children and adults who want to explore the secret of cosmic chemistry (https://spacecentre.co.uk/whats-here/#!mg_ld=591). The second example is the simulator in the Immersive Venus exhibit (Figure 4).
With wrap-around projections on a curved wall and a surround-sound system, visitors in the Venus Simulator pretend to be in an aircraft with destination Venus (https://spacecentre.co.uk/blog-post/new-immersive-venus-exhibit-opens/). It takes visitors on journey through the Venusian atmosphere, and it includes a vibrating floor— developed by the in-house design team—which adds the final touch to this multi-sensory experience and creates the physical feeling of landing. The Space Oddities gallery exhibits the unusual objects and tells interesting but lesser-known parts of space history. The Interactive table (Figure 5) in this gallery allows up to six individuals or small groups to find out about the stories of objects, space oddities, and astronauts and related information at the same time, so it is a place for exploring, communication and sharing.
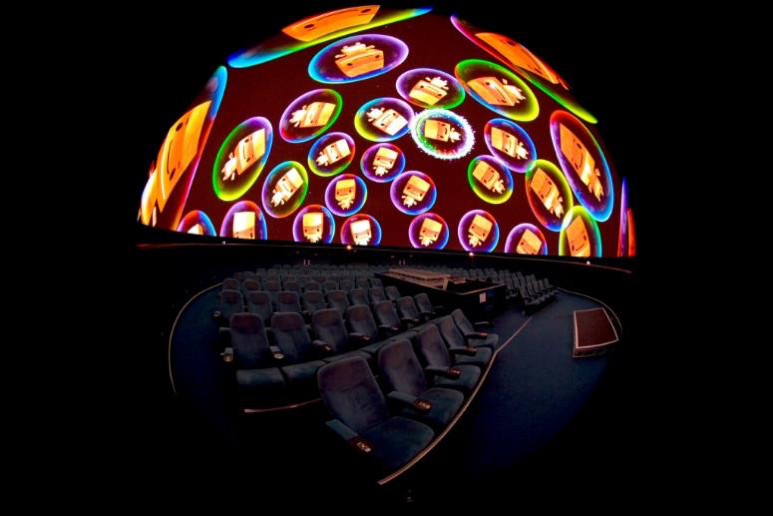 |
| Figure 3: Photo of Sir Patrick Moore Planetarium. Photograph National Space Centre.
|
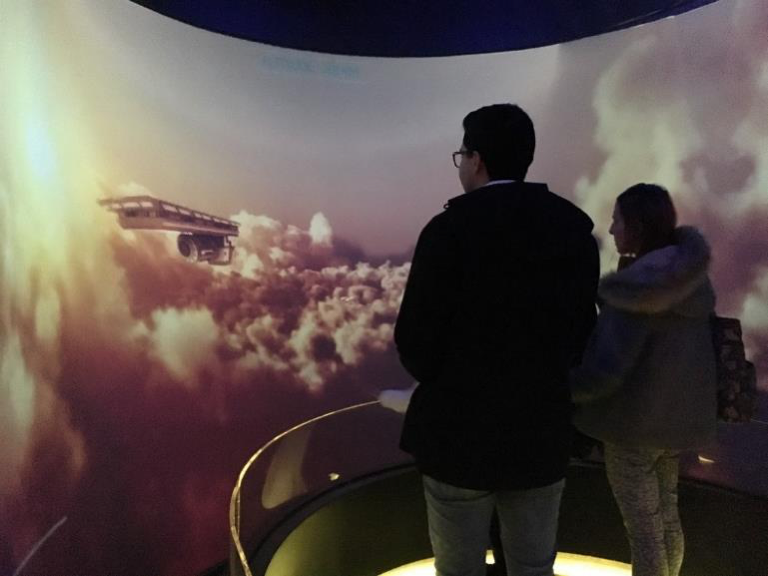 |
| Figure 4: Photo of visitors in Venus Simulator.
|
 |
| Figure 5: Photo of the Space Oddities exhibition with the interactive table in middle of the room. |
Considering the purpose of this research, which is to design a framework of measuring and understanding visitors’ sensory and emotional engagement with emerging technology, the study has an evaluative design and uses trials for method development. This means that, after the initial design and prototype of the evaluative framework, it will be tested and improved through trials. Therefore, the fieldwork phase of this field research consists of a pilot study and three design cycles. The pilot study is used for the researcher to familiarise themselves with the environment and practice data collection techniques. After the pilot, the main fieldwork is divided into three cycles; in each design cycle, different tools of evaluation will be tested. A combination of qualitative and quantitative methods was used for data collection. Participants of the research are randomly selected—adult visitors who interacted or would interact with those digital installations. At the same time, to decrease bias in interview data, the researcher recruited visitors of different gender and age (culture background and disabilities were not taken into consideration in this research) to generate an overall understanding of the visitors’ experience of in-gallery digital technology and their feelings. Cycle one was conducted in 2017, cycle two was tested in early 2018, and the last cycle was finished in the end of 2018.
In cycle one, three orthodox evaluation methods in museums studies were applied, namely interviews, observation, and questionnaires. Interviews allow the research to keep a strong focus on the topic and reveal the interviewee’s feelings, opinions, and attitudes to the interviewer in a more direct way (Rubin and Rubin, 2015). As the research aims to understand users’ personal feelings towards the digital environment, rather than the outcomes of engaging with these technologies, the interview takes place right after they finish the activity. Short, semi-structured interviews with open questions allow visitors to express their own opinions freely. Observation is another common method used in visitor studies research. Observation can reveal visitor behaviour and help the researcher to find out about issues that are less visible (Yin, 1984). This study uses indirect observations via video recordings to detect the visitor’s reaction towards emerging technologies, including gesture, facial, and verbal expressions. In terms of questionnaires, generally there are two main types of questionnaire prompts: multiple choice and open-ended (Kothari, 2004). Questionnaires for this research are designed combining both. The open-ended questions give participants more freedom to express their opinions in their own words—designed based on Sensory Experience Elicitation Protocol (Gretzel and Fesenmaier, 2010), while the multi-choice questions, designed with PAD (i.e. pleasure, arousal and dominance) Semantic Differentiate Scale, a verbal emotional measurement scale developed by Mehrabian and Russell (1974)—aim to understand visitors’ emotions more accurately through the three dimensions. In total, 150 questionnaires, 18 interviews, and 30 selected clips of observation have been collected across the three digital installations in the first cycle.
However, after analysing the results of Cycle 1, one important element seemed to be missing in all three data collection techniques: time. Visitor’s sensory and emotional experience could change a lot over time, due to various reasons such as visual and audio effects, contents, surroundings, etc. Visitors’ experience with the interactive table generally lasts between 2 and 10 minutes, the Venus Simulator is around 6 minutes long, and the planetarium experience is even longer (about 30 minutes). Hence, when it comes to the original evaluation methods, especially interviews and questionnaires, the first round of field research was not able to capture the change in visitors’ experience over time, as these two sets of data are collected once visitors have already completed their experience. Therefore, the study made two main changes in Cycle 2. Firstly, key questions in the questionnaires were designed taking into account visitor experience before, during, and after the activity. Secondly, the interviews were replaced by “think-aloud,” a technique commonly used in human-computer interaction and usability tests. Instead of asking questions after visitors finished their experience, participants are asked to wear a clip-on microphone while they view and use those digital installations. In the meantime, they are encouraged to verbalise their thoughts about how they feel at that moment and speak into the microphone.
In Cycle 2, although some partial real-time data was collected, the research was unable to fully capture visitor experience in real time. Also, in both Cycle 1 and 2, all methods were filtered either by visitors themselves (in interviews, questionnaires and think-aloud) or the researcher (in observations), raising questions of reliability. Therefore, the last design cycle went beyond traditional ways of evaluation and tried to measure visitors’ sensory and emotional experience using physiological measurements. Neuroscience has proved there are obvious signs of physiological responses to emotional changes (Purves et al., 2012). The increase or decrease of physiological activity, such as heart rate, facial muscle movements, sweat, and gastrointestinal motility can indicate various emotions (Purves et al., 2012). Considering this link between physiological changes and emotions can perhaps allow us to explore the subjective personal feelings in a more objective way. This study chose to use two types of physiological measurements: Galvanic Skin Response (GSR) and heart rate. GSR, first proposed by Landis (1932), means electrical resistance change of the skin, which is determined by the sweat level on the skin.
To measure these two types of physiological data, a device called a “Shimmer3 GSR+ Unit” was used. The research chose Shimmer products because it was recommended by Effie Lai-Chong Law (Professor in Human Computer Interaction, University of Leicester), who is an expert in measuring users’ emotions in HCI. In addition, the device is very handy, easy to set up, and adopted by many studies. GSR+ is a wearable device for real-time data collection, display, and storage. The unit costs €428, and it contains an optical Pulse Sensing Probe (to be attached to the finger), optical pulse sensors (to be attached on to the earlobe), two GSR+ electrodes, two biophysical 9″ leads and one wrist strap (all used for this study). The software working alongside the Shimmer sensors is called Consensys, specially designed for configuring Shimmer devices, streaming real time data, and managing the collected data. The software comes in two version, Consensys Pro and Consensys Basics. The basic one is free to use and able to stream live time data, collect and download data for single device. Consensys Pro has more advanced functions, such as recording and plotting data for multiple devices, algorithms PPG-to-HR etc., with a yearly licence (for one computer) of €199. Consensys Basics is more suitable for visitor researcher and museum staffs who are familiar with MATLAB (for further data analysis, such as algorithms PPG-to-HR); otherwise, Consensys Pro would be a better option.
The procedure to use a Shimmer3 GSR+ Unit for data collection in this research is as follows:
- Participants are asked to read the information sheet and sign the consent form before participating in the research.
- Once they agree, the research explains how the device works.
- Participants are invited to use antibacterial hand gel before wearing the sensors.
- Two GSR+ sensing probes are attached to the participant’s fingers (index finger and middle finger) on one hand (if the participant is left-handed, sensors are attached to right hand; if the participant is right-handed, sensors are attached to left hand). The finger cuffs are also adjusted (if the finger cuff is too loose, it might lead to failure in data collection; if it is too tight, it may lead to discomfort for the participant).
- The optical pulse sensor is attached to the earlobe (same side as the GSR sensors).
- The wrist strap is attached to the participant’s wrist (same side as the sensors), and adjusted. The Shimmer3 device is then placed on the wrist strap.
- The jacks of two GSR+ sensors and the optical pulse sensor are connected to the Shimmer3 device.
- The device is turned on and the participant is free to experience the selected digital installations.
- Once finished, the device is turned off and the participant can take the sensors and wrist strap off.
- Hand gel is once again provided for participants.
- The sensors are cleaned with a disposable alcohol wipe.
The Potential of GSR as a Visitor Studies Tool
A GSR signal can reveal emotional engagement and psychological arousal. It is a tool that has been applied to many studies such as affective computing, cognitive research, and marketing. The results of the GSR trial at the NSC showed not only how the tool can record visitors’ feeling over time but also captured the intensity of arousal with the We Are Stars! storyline. However, by measuring the GSR signal alone, it is hard to tell whether the emotion is positive or negative. In fact, both happy and angry emotions may show an increased of arousal level. This problem could be solved by using it in conjunction with other tools, such as observation.
In this cycle, GSR and PPG data from 15 participants engaging with digital interactives has been collected (5 participants per each interactive) with Shimmer3 (Figure 6). The device showed real-time data in its software, Consensys, when connected to a laptop or desktop through Bluetooth. Because the experiment is conducted in a museum (instead of a laboratory), all data collected is stored in the device and uploaded to a computer once the researcher leaves the site. Participants experience the digital installations by themselves; the researcher will not interrupt them during the process. In order to match up the starting point for each participant, participants for the planetarium and Venus are given a voice recorder; video recording is used instead for participants at the interactive table. This section mainly shares results of the planetarium show and Venus simulator.
 |
| Figure 6: Photo of a participant wearing Shimmer3 GSR device on her hand. |
The total length of the planetarium show We Are Stars! is 26 minutes, 18 seconds, and it consist of three stages, one minute before the show starts (00:00 to 01:00), the show itself (01:00 to 26:03), and 15 seconds after the show finishes (26:03 to 26:18). Table 1 shows the GSR signal collected for this experience. One participant’s data have been removed, because one of the sensors did not work properly. Although the GSR data of the four participants seems very different, some patterns can be found. Firstly, the GSR levels rise at the start of the experience, from the beginning to around one minute. Then, though there are fluctuations, the general trend tends to decrease slowly, with a slight increase in the last two minutes. Compared with findings in former rounds of fieldwork, this pattern could be easily explained. The increase in the beginning could be due to the fact that visitors generally feel excited when they first see the planetarium: the huge dome above the room is a brand-new experience for them. When the show starts, visitors are more likely to relax and enjoy the show. At some specific points, the vivid 3-D visual effects, with impressive images of the universe or interesting narratives, might cause the increase of arousal levels. Towards the end, the montage summarising the journey life has gone through in reverse chronological order, from humans and other living creatures to dinosaurs, to the birth of Earth, to the Big Bang and to protons and electrons, increases arousal in participants.
 |
| Table 1: Line graph of four participants GSR signal of experience the planetarium show ‘We Are Stars!’ |
The data collected in the Venus Simulator (Table 2) also shows the connection between GSR data and the plot. The simulator experience is 5 minutes, 3 seconds long. The table below includes 15 seconds before the start and 5 seconds after the end. The graph can be divided into four stages, 00:00 to 00:35, 00:36 to 01:12, 01:13 to 03:25, and 03:26 to 05:23. In the first stage, the participants board the observation deck, and the airship starts the journey towards Venus. Then, in the second stage, a beautiful view of the Venusian clouds and CO2 snow could explain why we see a lot of fluctuations in the graph. Next, the airship commander finds a problem, and they try to fix the problem. In this stage, the data remains stable. In the last stage, dramatic waves can be seen in the graph, probably because a lot of important events happen at this stage. (The crew realise the problem with the aircraft is really serious, triggering a warning alert in the airship as they prepare for landing.) Also, at this stage, visitors can feel strong vibrations coming from the floor.
 |
| Table 2: Line graph of four participants GSR signal of experience Venus Simulator. |
After the test in Cycle 3, there are a few things which need to be acknowledged about using the device to collect GSR data:
- Take into consideration hygiene when using the device, because participants wears the same set of sensors and device.
- Tell participants to keep the hand wearing the device as still as possible while engaging with the digital interactives, as movement may cause changes in the data collected. For example, in this study, when in the planetarium, participants are asked to put their hands wearing the device on the seat armrest; for the Venus simulator, they are encouraged to choose a comfortable position and remain still; for the interactive table, participants can explore the content freely but are asked to rest the hand with the device on the table.
- Make sure participants do not speak during the whole process, as speaking may influence the accuracy of data collected.
- Turn on the device at least one minute before the experience starts to set a base line.
- Take the PPG data, and convert it to the estimated heart rate; the device should be set to comparatively high frequency (higher than 128 Hz).
Conclusion
Is our classic visitor studies toolset still effective for measuring user experience in the new wave of in-gallery technology? As we create more multi-sensory, multi-user, immersive experiences, are the traditional evaluative models (built around usability and learning) still fit for purpose of understanding our visitors’ emotional and sensory responses?
In order to address these questions, drawing upon the “sensory turn” in museum studies, and informed by psychology, marketing, and neuroscience, this paper highlights the practical application and value of using techniques such as GSR, to measure visitors’ sensory and emotional experience with in-gallery interactives. The field study at the NSC, especially the first two design cycles, points to how orthodox evaluation tools, such as interviews and questionnaires, may have limitations in gathering emotional and sensory feedback from visitors. Specifically, these tests showed that just as interviews only capture visitors’ feelings once the experience is finished, similarly questionnaires can only tell general feedback, and it is hard to track how participants feel at a specific moment in time. The classic triptych of observation, interviews, and questionnaires may have become visitor study orthodoxy, but what this research exposes is how each falls short of showing experiences of concurrent and non-filtered (and perhaps non-verbal) data.
We need to look for new tools that could give us new insight for understanding these new sensory and emotional journeys within in-gallery digital media. For instance, in the case of the NSC study, the use of the “think-aloud” (to replace interviews) allowed for partial real-time verbal feedback and, in doing so, captured visitors’ feelings from their beginning to end. Similarly, the use of PAD (a tool new to museum practice, from the world of psychology and marketing), allowed for a richer representation of emotional experience, starting to reveal the variety of emotions when engaging with in-gallery technology, similarly, and perhaps most excitingly for this study, the use of GSR (a very rarely used tool in museums). This physiological measurement requires special equipment (GSR devices), training, and skills, and it may not be suitable for all formats of in-gallery interactives (for example, not applicable when visitors need to move a lot or speak to interact with digital technologies). In general, the tool is easy to use and set up; and more importantly, it allows us, for the first time, to capture emotional arousal and begin to acknowledge how visitors’ experience with interactives changes overtime.
Indeed, the results obtained with Shimmer3 GSR+ to measure visitors’ engagement with three different formats of technology have proven that the tool is able to reflect concurrent, non-filtered, and non-verbal responses from emotional arousal. And, interestingly, in laboratory settings, studies in other areas are already showing how specific emotions could be recognized from heart rate and GSR signals (Goshvarpour et al., 2018; Kreibig, 2010). The tool has the potential to be used in museum studies and practice for a better understanding our visitors and their experiences.
As we look back on the rapid change in in-gallery technology, and look forward to new ways of understanding, measuring, and evaluating visitor experience, studies such as this offer a glimpse into the new approaches we may need to take, and they provide the basis for a new toolkit for visitor evaluation in museums.
References
Black, G. (2005). The engaging museum: Developing museums for visitor involvement. Oxford: Routledge.
Candlin, F. (2010). Art, museum and touch. Manchester: University of Manchester Press.
Chan, S. (2014). ‘Too busy to blog: a short round up of 2014.” Seb Chan’s Blog, 28 October. Accessed: 8 January 2019. Available at: http://www.freshandnew.org/
Chatterjee, H. (2008). Touch in museums: Policy and practice in object handling. Oxford: Berg.
Cluett, S. (2014). “Ephemeral, immersive, invasive: Sound as curatorial theme, 1966–2013.” In N. Levent & A. Pascual-Leone (eds.). The multisensory museum: Cross-disciplinary perspectives on touch, sound, smell, memory, and space. Blue Ridge Summit, PA: Rowman & Littlefield Publishers, 109–118.
Drobnick, J. (2014). “The museum as smellscape.” In N. Levent & A. Pascual-Leone (eds.) The multisensory museum: Cross-disciplinary perspectives on touch, sound, smell, memory, and space. Blue Ridge Summit, PA: Rowman & Littlefield Publishers, 177–196.
Dudley, S. H. (2010). Museum materialities: Objects, engagements, interpretations. London; New York, NY: Routledge.
Goshvarpour, A., Abbasi, A. and Goshvarpour, A. (2018). “An accurate emotion recognition system using ECG and GSR signals and matching pursuit methods.” Biomedical Journal, 40, 355–368.
Gretzel, U. and Fesenmaier, D. R. (2010). “Capturing sensory experiences through semi-structured elicitation questions.” In M. Morgan, P. Lugosi and B. Ritchie (eds.). The tourism and leisure experience: consumer and managerial perspectives. Channel View Publications.
Howes, D. (2014). “The secret of aesthetics lies in the conjugation of the senses.” In N. Levent & A. Pascual-Leone (eds.) The multisensory museum: Cross-disciplinary perspectives on touch, sound, smell, memory, and space. Blue Ridge Summit, PA: Rowman & Littlefield Publishers. 285–300.
Kothari, C. R. (2004). Research Methodology: Methods and Techniques. New Age International.
Kreibig, S. K. (2010). “Autonomic nervous system activity in emotion: A review.” Biological Psychology, 84, 394–421.
Landis, C. (1932). “Electrical phenomena of the skin.” Psychological Bulletin, 29, 693–752.
Leahy, H. R. (2012). Museum Bodies: The Politics and Practices of Visiting and Viewing. Ashgate.
Levent, N. and Pascual–Leone, A. (2014). The Multisensory Museum: Cross-disciplinary Perspectives on Touch, Sound, Smell, Memory and Space. Blue Ridge Summit, PA: Rowman & Littlefield Publishers.
Mehrabian, A. and Russell, J. A. (1974). An approach to environmental psychology (1st Ed.). Cambridge, Mass.: MIT Press.
Mihalache, I. D. (2014). “Taste-full Museums: Educating the Senses One Plate at a Time.” N. Levent & A. Pascual-Leone (eds.). The multisensory museum: Cross-disciplinary perspectives on touch, sound, smell, memory, and space. Blue Ridge Summit, PA: Rowman & Littlefield Publishers, 197–213.
Pallasmaa, J. (2014). “Museum as an embodied experience.” In N. Levent & A. Pascual-Leone (eds.). The multisensory museum: Cross-disciplinary perspectives on touch, sound, smell, memory, and space (pp. 239–250). Blue Ridge Summit, PA: Rowman & Littlefield Publishers.
Pascual-Leone, A. and Hamilton, R. H. (2001). ‘The metamodal organization of the brain’, Progress in Brain Research, 134, 427–445.
Pascual-Leone, A., Amedi, A., Fregni, F., and Merabet, L.B. (2005). “The plastic human brain cortex.” Annual Review of Neuroscience, 28, 377–401.
Purves, D., Augustine, G. J., Fitzpatrick, D., Hall, W. C., LaMantia, A. and White, L. E. (2012). Neuroscience (5th Ed.), Sunderland, Mass.: Sinauer Associates.
Pye, E. (2007). The power of touch: Handling objects in museum and heritage context. Walnut Creek, CA: Left Coast Press.
Rubin, H. J. & Rubin, I. S. (2005). Qualitative Interviewing: The Art of Hearing Data. Thousand Oaks, CA: Sage.
Stevenson, R. J. (2014). The forgotten sense: Using olfaction in a museum context: A neuroscience perspective. In N. Levent & A. Pascual-Leone (eds.). The multisensory museum: Cross-disciplinary perspectives on touch, sound, smell, memory, and space (pp. 151–166). Blue Ridge Summit, PA: Rowman & Littlefield Publishers.
Uchida, M. and Peng, J. (2019). “Feeling the exhibit: design for an immersive and sensory exhibition experience.” In K. Drotner; V. Dziekan; R. Parry and K. C. Schrøder (eds.). The Routledge handbook of Museums, Media and Communication (pp.312-320). Routledge.
Voegelin, S. (2014). “Soundwalking the museum.” In N. Levent & A. Pascual-Leone (eds.). The multisensory museum: Cross-disciplinary perspectives on touch, sound, smell, memory, and space. Blue Ridge Summit, PA: Rowman & Littlefield Publishers, 119–130.
Cite as:
Peng, Jingyu. "How Does This Exhibition Make You Feel? Measuring Sensory and Emotional Experience of In-Gallery Digital Technology with GSR Devices." MW19: MW 2019. Published January 15, 2019. Consulted .
https://mw19.mwconf.org/paper/how-does-this-exhibition-make-you-feel-measuring-sensory-and-emotional-experience-of-in-gallery-digital-technology-with-gsr-devices/